7 Day Forecast
The first big heat wave of 2025 arrived, coinciding with the official .
More than 40 million people in the U.S. were under heat alerts Friday, according to the National Weather Service. Temperatures in the Midwest were expected to crest well into the 90s Fahrenheit this weekend. Triple-digit highs are possible in New York, Philadelphia, Washington and Denver. The peak likely will hit the East Coast early next week.
Meanwhile, British health officials also issued heat warnings for the .
Humans are on track to release so much greenhouse gas in the next three years that a key threshold for limiting global warming will be very hard to avoid, according to a new study.
Climate change  and the problem isn't going away any time soon. An increasingly hot planet — due largely to burning fossil fuels such as coal, oil and natural gas — means .
People are also reading…
Heat doesn't just mean canceled . It also poses a health risk, especially for children, older people and those with certain health conditions.
Here are some tips to stay safe:

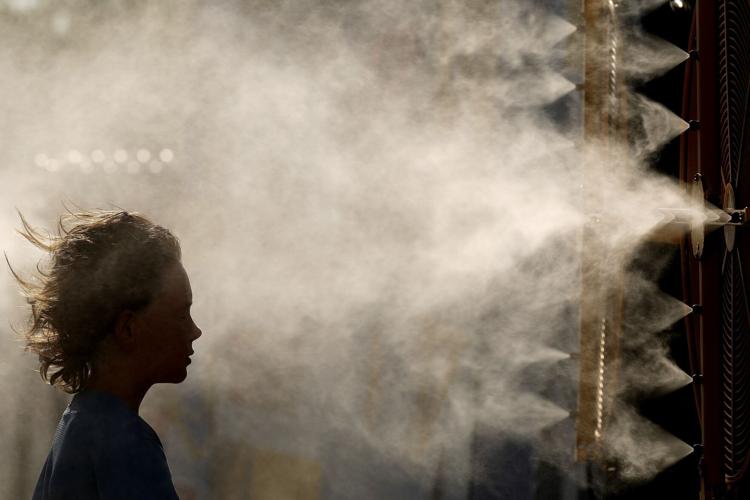
Michael Mullenax, 10, from Lee's Summit, Mo., cools off in a mister June 24, 2024, at Kauffman Stadium in Kansas City, Mo., before a baseball game between the Kansas City Royals and the Miami Marlins.
When does heat become dangerous?
The answer depends on more than the temperature. The most detailed measurement is called the wet bulb globe temperature (WBGT), which includes temperature, humidity, cloud cover and wind. The heat index, which measures temperature and humidity, is less descriptive but easier to find on weather apps. Both explain why a shaded soccer field on a 90 degree F day (32 degree C) in arid Phoenix may be less risky than an exposed park on an 80 degree F (27 degree C) day in soupy Little Rock.
Just based on heat index, NOAA  that calculates how dangerous prolonged exposure can be. For example, a day where temperatures reach 96 degree F (36 degrees C) and 45% humidity would fall into the “danger” category for prolonged exposure or strenuous activity.
The WBGT threshold isn't exact, but  suggests that even some young, healthy people can't endure hours of exposure to high heat and humidity.

Mirabelle Demske, second from left, uses a portable electric fan June 20, 2024, to cool off her friends Faith Hamzy, center, and Annie Sayre, second from right, at YMCA Camp Kern in Oregonia, Ohio.
How to cool down
High overnight lows can be a particularly dangerous part of a heat wave, said Ashley Ward, director of the Heat Policy Innovation Hub at Duke University. “Your body needs a reprieve,” she said. “You don't get that overnight, we start the next day at a deficit.”

Heat can worsen labor productivity and lead to more visits to the emergency room.
“When we have overnight temperatures that don't drop below 75 degrees (F)," Ward said, “You start to see some pretty extraordinary outcomes with respect to heat illness and heat stroke, and even mortality.”
Her answer: Find air conditioning. That might be at home, but she said census data overcounts how many people have access.
If you can't afford to cool the whole house, Ward said, create a “cool corner" and sleep there, so your body is prepared to tackle the next day.
Evaporative or “swamp” coolers can help in dry heat, but they increase humidity and can make it more difficult to cool down. In humid places, just use a fan.
If you don't have air conditioning, find public places that do, including movie theaters, malls and libraries. Some communities set up cooling centers.
Depending on where you live, the Low-Income Home Energy Assistance Program can help you buy a window air conditioning unit, . Some community nonprofits and civic organizations can also  if cost is a burden.

Giselle Berastegui, left, and her brother Tony Berastegui Jr. drink water July 17, 2023, in Phoenix.
If you work outside, know your rightsÂ
Knowing what workplace protections you have is important. But there are no federal heat rules to protect workers in the United States.
Some states have them, including Washington, Oregon, California, Nevada, Colorado, Minnesota and Maryland, according to  Other states don't have any.
If your state has work rules, try to learn them — though there are still challenges to ensuring regulations are actually enforced, said Bharat Venkat, director of the University of California, Los Angeles Heat Lab.
He notes that sometimes shaded areas are too far for workers to take breaks without losing wages, or that management can make it impossible for workers to advocate for themselves. “Most workers don’t actually have control over their time or control over where they work," he said.
Within those constraints, finding ways to stay hydrated and lower your body temperature are paramount. You can do this by drinking lots of fluids, wetting clothing or putting cold water or a cold rag on your hands, feet, armpits and neck. A portable handheld fan or a cooling vest can also help.
If you're exercising, avoid the hottest times of day and bring more water than you think you need.
Jason Chrapek is a clinical assistant professor in the Department of Health and Kinesiology at Purdue University. In this video, he explains how you can exercise safely during the hot summer months.
Know heat illness symptoms
Heat illness symptoms can vary by person, Venkat said. Medications or underlying conditions can also make it harder to regulate body temperature or notice you're getting too hot.
·ˇ˛ą°ů±ô˛âĚý include heavy sweating, muscle cramps and headache. That's when you stop what you're doing and cool yourself off — for example, by splashing yourself with cold water or finding an air conditioned space.
As heat exhaustion sets in, new symptoms arrive, including faster heart rate and dizziness. Next comes heat stroke, which can include confusion, slurred words and fainting. Ward said that's when to call 911.
“Don’t be embarrassed to call 911 or go to urgent care when you think you might have overdone it in the heat,” he said.
___
Walling reported from Chicago. Wells reported from Cleveland.
Why sizzling cities are mapping hot spots street by street
Why sizzling cities are mapping hot spots street by street

The city of Reno, Nevada, is breaking records in ways it doesn't like: A 2024 analysis of 241 cities showed that Reno has heated up faster than any other city in the United States.
While the country as a whole by 2.6 F on average between 1970 and 2023, Reno saw an increase of 7.6 F. A heat wave that hit Reno in July 2024 made for the hottest month in the Biggest Little City's documented history, explains.
Reno's heat is not evenly spread. In the summer, neighborhoods near the airport feel ovenlike compared to the more affluent, cottonwood-shaded homes near the Truckee River. The sidewalks of pavement-heavy shopping centers and casinos in the city center offer little relief; those in the green-space-rich neighborhoods of South Reno are kinder. The city's main thermometer, located at the airport, doesn't tell you anything about those differences.
And neither, it turns out, do temperature-mapping satellites—their resolution is far too coarse.
Which is why I found myself attaching a snorkel-like sensor to my car window on a clear and toasty August day, along with 75 other volunteers with their own sensors and cars. We split up along 20 routes and cruised through Reno in the morning, afternoon or evening. My partner and I drove a slow evening loop in the Galena neighborhood, where large, lush properties—the median home price is over $1 million—are flanked by patches of sagebrush. Even at 7 p.m., it was 92 F.
By the time we finished the loop, dusk had set in and my car thermometer had dipped to 83 F. But as we headed to the volunteer station in the city center, the gauge climbed back up to 89 F. Such gradients are common in cities, and commonly remarked upon, but they are rarely precisely measured and mapped.
![]()
Longer-lasting heat waves ahead

Today, locating the hottest parts of cities with precision is critical for guiding efforts to . As climate change brings more intense, frequent and longer-lasting heat waves, heat-related illnesses and deaths also climb. High-resolution maps can alert officials to spots facing the greatest risks, so they can plan. It's especially important when heat risk overlaps with poverty, where communities may have less access to and fewer ways to stay cool.
Maps pieced together by the sensors "will help us be able to target, down to the street level, where we can plant more trees to help people better endure the hotter days of summer," says Brian Beffort, sustainability manager for Washoe County, home to the Reno-Sparks metro area. The maps will also guide where to focus efforts to weatherize buildings so they require less energy to cool.
Campaigns to record temperatures across city neighborhoods and create better heat maps are on the rise. Reno is one of more than 80 U.S. communities that since 2017 have completed a with the aid of citizen scientists, efforts overseen by the National Oceanic and Atmospheric Administration. NOAA has also supported a few international mapping efforts in cities such as Nairobi, Kenya, and Salvador, Brazil.
Local officials are using the data to plan how to adapt to, and fend off, rising urban temperatures. Some have begun to plant trees, install reflective materials and take other measures to cool the hot spots.
Hot spots within heat islands

Cities tend to be warmer than the open spaces around them, a well-known phenomenon called the heat island effect. Roads, parking lots and roofs tend to absorb more heat than soil and vegetation. City buildings add surfaces that hold on to heat while reducing circulation of cooling breezes. Human activities, from powering cars and appliances to simply existing (think body heat), give off what's called anthropogenic heat.
Climate change is amplifying this effect. While the average global air temperature has increased about 2 F, "overheating in cities is really five to six times higher," says Mat Santamouris, an architectural scientist at the University of New South Wales in Australia. In Sydney, where he lives, the annual number of days with an average daily 24-hour temperature exceeding 65 F— without needing cooling—has gone up more than threefold since 1990, an increase 10 times that of the surrounding natural areas. During heat waves, the heat island effect is often magnified, with temperature differences between urban and undeveloped areas growing even wider.
The heat island effect isn't uniform within a city, and heat maps can line up with . Affluent areas tend to have more trees, parkland and water features, while poorer communities likely have more heat-absorbing paved surfaces and less tree canopy. That translates into a greater risk for some people as temperatures inch up.
Excessive heat is among the most dangerous of weather-related hazards. During heat waves, can increase up to 11 percent for every 1 C (1.8 F) increase in the surrounding air, researchers find. One analysis of temperature and health data collected in summer months in California reported that a 10 F temperature increase was associated with . Heat waves trigger more emergency department visits, with young children and those over 65 facing the highest risk. There's also an uptick in from kidney problems, cardiovascular disease, diabetes and electrolyte imbalances.
Perhaps surprisingly, have not known where to expect the most extreme urban heat. Relying on temperature data from satellites provides a relatively crude map: Climate research has historically relied on remote sensing made up of pixels that correspond to 30-by-30-meter squares—and while that's useful for depicting larger weather and climate patterns, it misses a lot. Community-led heat-mapping projects fill those gaps by logging temperature and humidity every second at precise locations, five feet above the road, as volunteers drive their assigned routes.
"A satellite can't tell you what you feel like when you're walking down the street," says Max Cawley, director of climate research and engagement at the Museum of Life and Science in Durham, North Carolina, who helped coordinate a volunteer heat mapping campaign in that area.
Heat mapping volunteer campaigns have revealed disparities as high as 20 F between parts of the same city, says Joey Williams, a program manager at the climate adaptation consulting firm CAPA Strategies, which works with city data in partnership with NOAA. In a 2019 study analyzing both satellite and car-mounted sensor data taken from campaigns in three mid-Atlantic cities, he and coauthors found , with temperatures varying by over 15 F. In a midsize or large city on a 90-degree-plus day, it's typical to see differences of at least 10 F, he says.
Back in Reno, the measures I helped to take last summer revealed a dramatic maximum temperature difference of 23 F. Part of that gap was elevation-based—some neighborhoods sit a few hundred feet higher. Still, southern Reno neighborhoods with ample green space were about 10 F cooler on the afternoon of the mapping day compared with more central hot spots near highway and industrial areas. Some less-vegetated suburbs in the adjacent city of Sparks, Nevada, were also running hot.
Targeted cooling

In many communities, heat campaign data are already being used to target spots most in need of cooling resources.
After in Toledo, Ohio, officials found that the city's hot spots often overlapped with census tracts identified by the Biden administration's as lacking in commercial investment and overburdened by pollution. (In January 2025, the Trump administration removed and references to the project from government websites.) Some parts of the city were 11 F hotter than others at midafternoon on the summer mapping day. City sustainability coordinator Beatrice Miringu says that the data helped to secure a $6.1 million grant to plant more than 10,700 trees, funded by the 2022 Inflation Reduction Act.
In the Raleigh-Durham area of North Carolina, Cawley says that heat-map data from the area's 2021 campaign are helping officials to identify streets to spray with reflective titanium dioxide, a covering that helps to bring down street-level temperatures. They are also displayed at the Museum of Life and Science and incorporated into public school physics and history curricula.
Neighborhood organizations can also use the data to inform heat-safety outreach by, for example, calling or texting people when temperatures climb to dangerous levels.
"Heat is a hyper-local impact. It imperils people really differently on a neighborhood-by-neighborhood, and sometimes block-by-block, level," says Cawley. "People who are impacted ought to have a pretty big say in how this is mitigated and dealt with." Some neighborhoods, for example, might need immediate help paying for increased air conditioning use; after all, trees need years to grow into a shady canopy.
Often, the most effective way to expand canopy is to maintain the health of existing trees rather than only planting new ones—though such maintenance efforts are more expensive and get less press, says Erica Smith Fichman, city forester for Philadelphia's Parks and Recreation Department, where officials use heat mapping data to design the city's forestry plans.
Data from Reno and elsewhere will also help to improve local climate models and so better predict warming impacts down to the street level, says John Mejia, a climatologist with Nevada's . Mejia led a similar mapping effort in Houston and advised another in Las Vegas. He has built an urban climate model of Las Vegas, which he can use to "play God" and, for example, add more trees to the simulation to observe their effect on temperatures. "We can use the heat map data to contrast the model output versus the observations," he adds, thus improving the model.
Designing for overheated cities

As more and more cities roll out heat-mitigation efforts, their impact on the heat island effect will be closely followed. Research suggests that smartly designed plans should bring relief, says Santamouris, coauthor of a 2023 review on in the Annual Review of Environment and Resources.
Greenery alone can reduce peak temperatures by up to 2 F, and while trees obviously provide shade, they also release water vapor, which can cool the air in drier climates, he says. Roofs and pavements covered in light-colored, reflective material so they absorb less heat can decrease temperatures by up to 3 F. Added together, cool surfaces and vegetation can reduce peak temperatures by up to about 5 F during the day and even more at night, Santamouris says.
Innovative surfaces can provide even more benefit. Santamouris' team, for example, is working on new, that can potentially reduce heat islands by 9 F.
Appropriate heat treatments depend on a region's climate, says James Voogt, an urban climatologist at Western University in Ontario, Canada, who coauthored a paper on in the 2020 Annual Review of Environment and Resources. In hot and humid areas, he says, increasing ventilation to carry heat away is crucial. In Southeast Asia, for example, it makes sense to design building developments with gaps to allow cool breezes to snake through structures. Where the air is dry, such as in the U.S. Southwest, adding shade is more important.
The researchers, local officials and nonprofit leaders who worked on the heat mapping campaigns in various cities are continuing to collaborate, says Tom Albright, deputy state climatologist and a geographer at the University of Nevada, Reno, who helped organize the Reno campaign. "There might be scientific questions that we can address really effectively only when we have the benefit of looking across multiple communities."
The exercise was also an eye-opener for some of the heat-mapping volunteers—revealing how much the experience of heat varies from neighborhood to neighborhood, for better or for worse. In Toledo, says Miringu, she received comments from participants who had never been to certain parts of the city before recording temperatures there. "It was quite a realization. If you're driving in an area with no canopy, and then you get into an area with canopy, there's that sudden shift in how you feel," she says. "It makes that information no longer a data point, but an experience."
And though the challenge of surmounting global climate change may often feel impossible, efforts to cool cities are a way for communities to try to cope, at least in their small patch of the Earth. When it comes to urban heat islands, "I'm quite a bit more optimistic that we're not going to see that accelerate," says Albright. "I think we have a lot more ability to control it locally."
was produced by and reviewed and distributed by Stacker.